Migrant Perceptions Survey
The Waikato Region ranks 69/100 in the annual Migrant Perceptions Survey, placing it within the top quarter of welcoming regions.
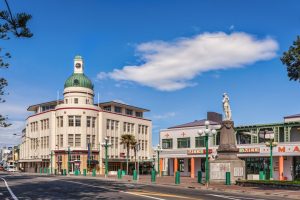
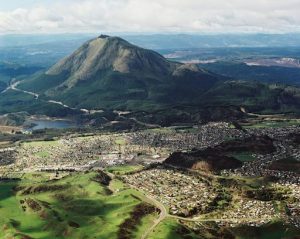
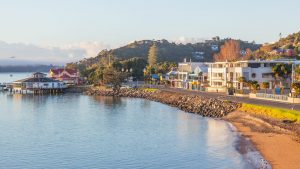
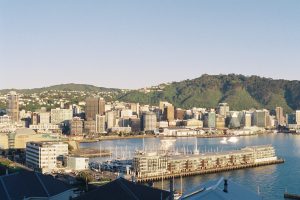
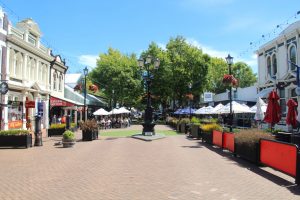
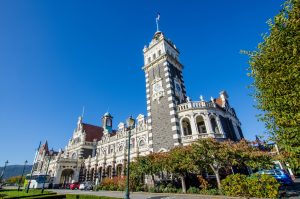
The Region is very diverse – with most migrants living in or around Hamilton City or the northern areas which border the Auckland region.
There are significant Chinese, Indian populations, as well as smaller Japanese, Korean, Thai communities.
Compared with most other regions, the migrant populations are younger on average – between 18 and 40. The demographic can be explained by the number of international students studying at Waikato University and the auxiliary businesses which support them.
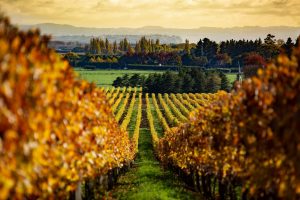
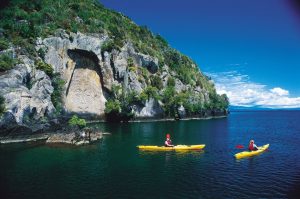
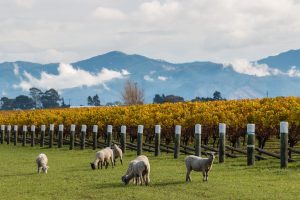
Migrants, especially Asian migrants, play a significant role in the Region’s economy. There is notable Asian investment in the Waikato: including tourism and hospitality, agriculture, dairy, honey, as well as food processing and logistics sectors.
The top reasons why Migrants want to live in the Waikato Region include:
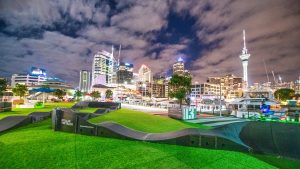
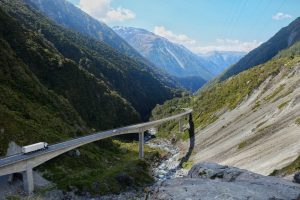
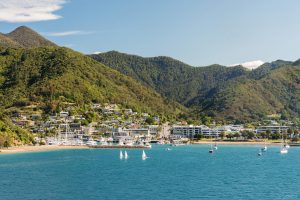
- Proximity to Auckland and Auckland International Airport
- Employment opportunities
- Affordable Housing
The Region is especially popular with young migrants 18-30, praising the Region’s openness to migrants and the improved transport links connecting the Waikato to Auckland and the Auckland Airport.
For more information about the Migrant Perceptions Survey please contact Eastern Bridge Limited
About the Migrant Perceptions Surveys
The Migrant Perceptions Surveys is a nationwide survey of migrant communities. The Survey is run annually by Eastern Bridge and collects data in Chinese, Japanese, Korean, Vietnamese and Russian from 20 sample regions.
The goal is to raise awareness of migrant communities and increase Local Government understanding of how they treat migrants, international students and international visitors. Participating councils receive recommendations on how they can make their communities more welcoming.
The Survey looks at a range of topics, including education, healthcare, housing, safety, employment, welcoming, travel, transport, services, entertainment.
Survey Results 2020
Regions Overall Score 2017-2020
| Region |
education |
healthcare |
housing |
safety |
employment |
welcoming |
travel |
getting around |
Services |
entertainment |
|
|
| Northland |
65 |
NA |
6 |
6 |
7 |
7 |
6 |
8 |
7 |
6 |
6 |
6 |
| Auckland City |
75 |
-3 |
9 |
8 |
5 |
5 |
8 |
6 |
9 |
8 |
8 |
9 |
| Auckland |
70 |
1 |
8 |
6 |
6 |
7 |
7 |
7 |
8 |
7 |
7 |
7 |
| Waikato |
69 |
4 |
8 |
7 |
6 |
6 |
7 |
6 |
8 |
6 |
7 |
8 |
| Central platau |
62 |
2 |
6 |
6 |
7 |
7 |
6 |
6 |
7 |
5 |
6 |
6 |
| Bay of Plenty |
69 |
NA |
8 |
7 |
5 |
6 |
7 |
7 |
8 |
6 |
7 |
8 |
| Eastern Bay of Plenty |
69 |
NA |
6 |
7 |
8 |
6 |
8 |
9 |
7 |
4 |
7 |
7 |
| Gisborne |
64 |
-1 |
6 |
6 |
8 |
6 |
7 |
8 |
6 |
5 |
6 |
6 |
| Hawke’s Bay |
62 |
4 |
8 |
7 |
7 |
6 |
7 |
6 |
5 |
5 |
5 |
6 |
| Manawatu-Whanganui |
63 |
1 |
8 |
6 |
7 |
5 |
6 |
8 |
6 |
5 |
6 |
6 |
| Taranaki |
66 |
1 |
7 |
7 |
7 |
6 |
7 |
8 |
6 |
5 |
6 |
7 |
| Wellington |
69 |
-1 |
8 |
7 |
5 |
6 |
7 |
7 |
8 |
6 |
7 |
8 |
| Wellington city |
76 |
NA |
9 |
8 |
5 |
7 |
7 |
8 |
8 |
8 |
8 |
8 |
| Nelson-Tasman |
66 |
NA |
8 |
7 |
5 |
7 |
6 |
7 |
7 |
6 |
7 |
6 |
| Malbrough |
59 |
-3 |
7 |
7 |
7 |
6 |
6 |
4 |
6 |
6 |
5 |
5 |
| West Coast |
55 |
-2 |
6 |
6 |
7 |
7 |
5 |
5 |
5 |
4 |
5 |
5 |
| Cantabury |
66 |
3 |
8 |
7 |
7 |
6 |
6 |
5 |
7 |
7 |
5 |
8 |
| Otago |
61 |
NA |
8 |
7 |
7 |
5 |
7 |
5 |
6 |
5 |
5 |
6 |
| Southland |
57 |
-3 |
6 |
6 |
7 |
6 |
5 |
5 |
7 |
5 |
5 |
5 |